Aggregation Functions
As described in the Sum, Count, Aggregate section of the guided tutorial, in Tabmega, the only way to compute aggregates like sums, averages, or counts is through pivot tables. This design might feel different at first, especially if you’re accustomed to typing =SUM(A1:A100) or =AVERAGE(B2:B500). However, there’s a solid reason for this approach: pivot tables give your analysis a structured framework that’s better suited for handling the enormous datasets Tabmega is built to handle.
When you write formulas for aggregate calculations in Excel or Google Sheets, you’re typically referencing cell ranges. This works well for smaller datasets, but as the amount of data grows, those formulas can become harder to manage, slower to calculate, and prone to errors. In contrast, Tabmega’s pivot tables encourage you to group, filter, and summarize data in a way that is both systematic and scalable. Instead of manually selecting ranges and writing individual formulas, you define how your data should be aggregated with a pivot table.

Summarize by functions in pivot tables
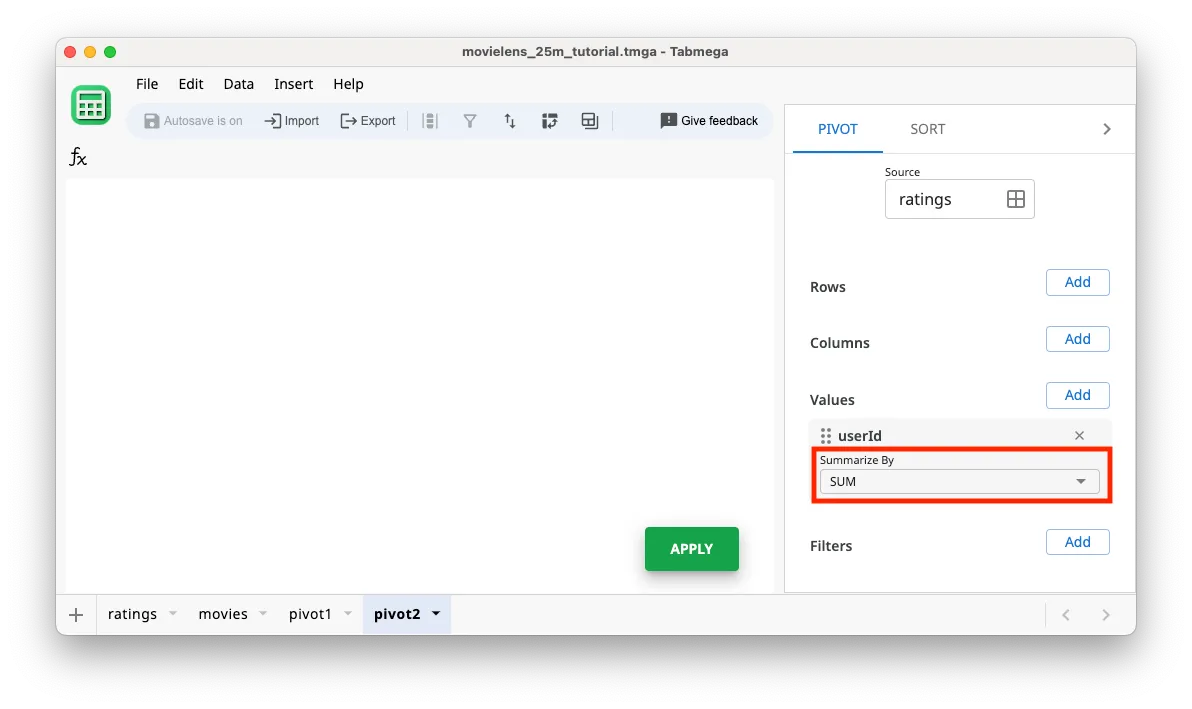
Below are the aggregation functions available for pivot table Summarize by.
| Name | Description |
|---|---|
SUM | Sum numeric values |
COUNTA | Count of non-blank values |
COUNTUNIQUE | Count of unique non-blank values |
AVERAGE | Average of numeric values |
MAX | Min of numeric values |
MIN | Max of numeric values |