When to use Tabmega?
When faced with the challenge of analyzing large CSV files, many people feel stuck between a rock and a hard place. Traditional spreadsheet tools like Excel or Google Sheets quickly falter when datasets exceed a million rows, while coding-based solutions like Python or SQL can be complicated, time consuming, and error-prone. Enter Tabmega: a desktop app specifically designed to bridge this gap.
Strengths of Tabmega
1. Big CSV files
Tabmega’s standout advantage over Excel and Google Sheets is its ability to handle massive CSV files. By comparison, Microsoft Excel imposes a strict row limit of 1,048,576, and Google Sheets caps out at 10 million cells (e.g. a dataset with 10 columns is limited to 1 million rows in Google Sheets).
With Tabmega, there is no fixed limit on the number of rows you can work with. Instead, its capacity scales with the power of your computer. For most modern laptops and desktops this means Tabmega can easily handle hundreds of millions of rows.
The tables below illustrate Tabmega calculation times on a base 2024 Mac mini that costs $599 using example datasets:
| Sample dataset size | Adding two number columns |
|---|---|
| 25M rows | < 1 sec |
| 50M rows | ~2 sec |
| 100M rows | ~4 sec |
| 200M rows | ~8 sec |
| Sample dataset size | XLOOKUP from another table |
|---|---|
| 25M rows | ~2.5 sec |
| 50M rows | ~5 sec |
| 100M rows | ~10 sec |
| 200M rows | ~20 sec |
From an engineering perspective, the secret sauce for Tabmega’s power and speed compared to traditional spreadsheets is it’s usage of DuckDB under-the-hood.
2. Simple
Tabmega offers a user-friendly spreadsheet interface, so if you’re familiar with Excel or Google Sheets, you’ll feel right at home. After all, people are most productive when they can focus on the data, not on writing code.
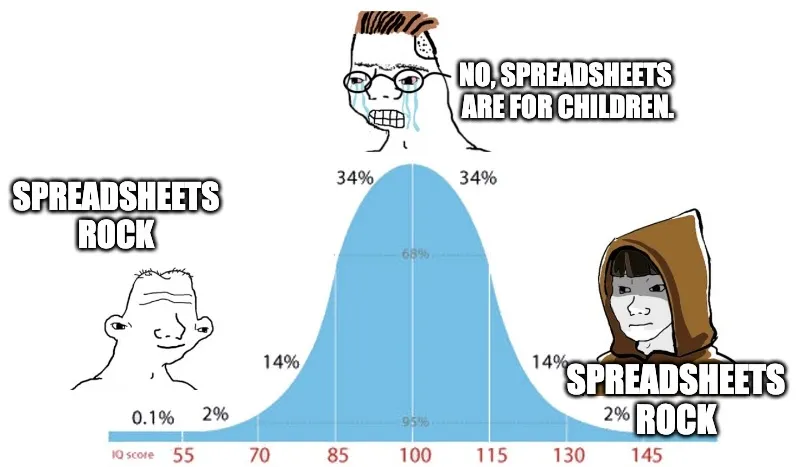
Spreadsheets are the most popular tool for data analysis in history. Even seasoned programmers often prefer spreadsheets because they make it easier to work with data directly. There’s no need to feel any shame in preferring a simple spreadsheet over coding—many of the smartest computer scientists in the world are on your side.
“Simplicity is the ultimate sophistication”
— Leonardo da Vinci

3. Local
With data breaches on the rise, keeping your sensitive information safe is more critical than ever. Tabmega runs locally on your computer, ensuring your data never has to leave your environment. Unlike cloud-based tools that require you to upload your files, Tabmega gives you complete control over your data.
4. Cost-Effective
Cloud services for data analysis can quickly become expensive. Tabmega offers an economical alternative by harnessing the power of the computer sitting on your desk. Today’s laptops and desktops are powerful machines with the disk space, memory, and compute power to handle most datasets. You save money by avoiding hefty cloud fees, all while achieving fast and efficient results.
5. Cross-platform
Many local data analysis tools only work on a single platform, such as Microsoft’s PowerPivot. If they are cross platform, like Python, they typically involve complicated setup and programming skills. Tabmega has an easy installation process on Windows, macOS, and Linux.
Weaknesses of Tabmega
1. Small data
We recommend you continue using Excel or Google Sheets if your data is small enough and you have a strong preference for those tools. Tabmega really shines for big data. One common workflow is to open your large CSV files in Tabmega, pivot and filter for the subset of data that interests you, and then perform further analysis in Excel and Google Sheets once the data is under 1 million rows.
2. No formatting and charts
Tabmega doesn’t yet have cell formatting features such as decimal places, currencies, percentages, italics, or bolding. It also doesn’t have charts at this point.
We launched without these features because you can still perform all these tasks in Excel and Google Sheets once you’ve pivoted and filtered your data to under 1 million rows with Tabmega.
3. Complex modelling
In order to scale to massive datasets Tabmega imposes more structure on the layout of your spreadsheet compared to Excel and Google Sheets. You can’t enter random formulas all over the place on a sheet. Instead your analysis needs to be structured around formulas for new columns, filtering, sorting, and pivot aggregations. The good news is that this is likely sufficient for your use case. Most of the time all people want is a lookup and a pivot table for some quick insights.
If you have more sophisticated needs, please give feedback. We hope to support more complicated analysis in the future and appreciate feedback to help prioritize.
Conclusion
Tabmega is more than just a tool; it’s a game-changer for anyone dealing with large CSV files. By combining power, simplicity, data control, cost-effectiveness, and cross-platform compatibility, Tabmega empowers users to analyze massive CSV files without the usual headaches.